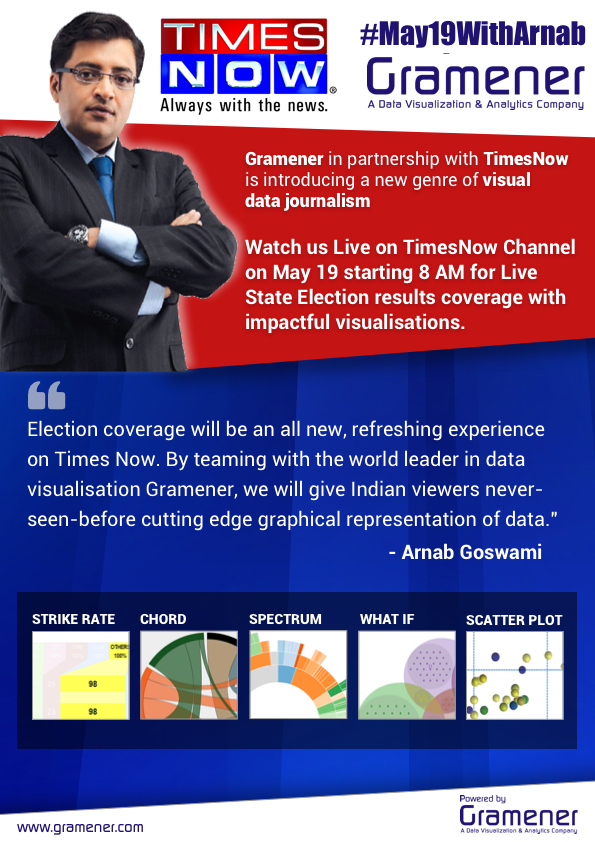
 19th of May was a momentous day, not just for the parties that swept to an absolute majority in the 4 State Assembly elections in India, but also for Gramener, which made a splash on national Television by covering the elections through visual analytics. With Gramener's partnership with Times Now having been forged hardly 6 weeks prior to the counting day, it was a daunting task to deliver insightful & engaging data visualizations, for the real-time streaming results of the votes tally. The most critical ask was to have this data journalism initiative designed and packaged in a way that it reaches the non-tech savvy, TV audience - millions of them, considering the clear leadership that Times Now has in the English News Channels segment.
The last similar outing for Gramener, at a comparable scale was during India's landmark 2014 Lok Sabha elections, which witnessed BJP's landslide victory. Then, we had tied up with CNN IBN TV channel, through a partnership with Microsoft. This was a big success as well, but very different in terms of the type of engagement and reach. The CNN IBN initiative was two-pronged: TV and Digital. The visual content was created as an interactive application and used for live reporting by anchors on a touchscreen TV. Then, there was the end-user-targeted Election analytics app, which was launched on the web through multiple channels - Microsoft Bing, Windows 8 app on the appstore and the CNN IBN website.
The content on TV was used more as an add-on reporting by anchors, while the main action and live debates happened in the primary studio, led by Rajdeep Sardesai, through their traditional means. There was good response to the visual reporting on TV , however the major reach was through the Digital channel, where we received over 10 million hits just within the 16 hours on the counting day.
For the recent initiative with Times Now, TV reporting was the only medium leveraged and as if to compensate for this, the visual analytics was integrated mainstream into all of the channel's programming. All reporting through the day, prime-time coverage and live debates were tightly strung together with our product's visuals.
And hence, the stakes were really high and our team had put in extra efforts to make this work on national television, with just a single opportunity to get it right in front of millions of live TV audience.
Reflecting on how things progressed on May 19th, what a day it was! The Gramener product's visual analytics was synced with the Times Now programming and everything worked out to clock-work precision. The visuals got a major boost with a pre-launch premiere on the 18th, a day prior to going live. There was very good visibility for the Visuals and ample co-branding for Gramener. Thankfully the 5 Visuals helped identify early trends, while the analytics helped give a clear picture of the evolving scene in each state, which in turn spurred a lot of meaningful debates.
As a bonus, couple of us got to participate in the show and contribute to the data stories on prime time. An equally enriching experience was in the On-Air backroom, to get a first hand experience of TV production. It was something to view from close quarters the zillion moving parts - video feeds from all over the country, editorial team live-feeding & curating the content, graphics team sending their animations & graphic designs, in-studio cameras shooting people at all angles, apart from several other technical teams editing and mixing all the content. It was amazing to see the technical mastery on how the show director and producer work through all this chaos, manage things on-the-fly and create a supposedly seamless and perfectly unified experience for viewers, on the screen!
There has been extremely positive reviews and feedback flowing in from various quarters. It was a delight to get additional reinforcement of the effectiveness from the all-important TV ratings, which is a gold standard to judge the popularity of shows.
Perhaps, there will be separate posts on the making-of-the-show: the preparations, technology architecture and on the production aspects. For now, do check out the below post by a colleague, which gives a good summary of the entire engagement.


No comments:
Post a Comment